What is RSI & How to Use It for Better Crypto Trades
RSI (Relative Strength Index) is a momentum indicator that helps traders measure whether an asset is overbought or oversold. It moves between 0 to 100, with values above 70 signaling an overbought market and below 30 indicating an oversold market. Traders rely on RSI to predict trend reversals, confirm market strength, and fine-tune their entry and exit points.
 Crypto Trading
 06:05 PM
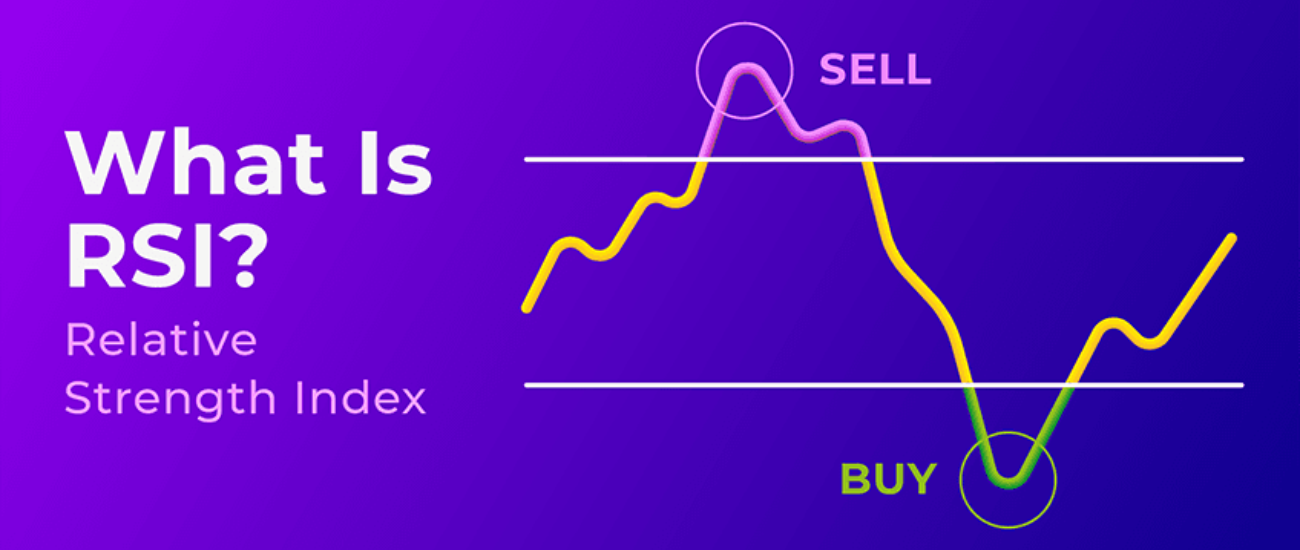
RSI (Relative Strength Index) is a momentum indicator that helps traders measure whether an asset is overbought or oversold. It moves between 0 to 100, with values above 70 signaling an overbought market and below 30 indicating an oversold market. Traders rely on RSI to predict trend reversals, confirm market strength, and fine-tune their entry and exit points.
Over 80% of professional traders use RSI as a key tool for technical analysis. Studies show that assets with RSI above 70 have a 65% probability of experiencing a price pullback, while those below 30 have a 70% chance of rebounding. The 14-period RSI is the most commonly used setting, offering a balanced view of price trends.
At PriceSync, we integrate RSI-based insights into our expert-crafted chart setups to help you trade smarter. Our daily price action analysis ensures you stay ahead of market movements. In this page, we’ll explore RSI, its importance, how to use it in crypto trading, and the best RSI strategies to improve your trades.
What is RSI?

The Relative Strength Index (RSI) is a technical indicator used by traders to measure the momentum of a price trend. It helps you understand whether an asset is overbought or oversold, which can signal when a trend reversal might happen.
RSI is represented on a 0-100 scale. This scale shows how strong or weak the current trend is. When you look at the RSI, you're mainly watching for two key levels: 70 and 30.
RSI Above 70: When the RSI is above 70, it means the asset is likely overbought. This means the price may have increased too fast, and it might soon reverse downward. Statistically, an RSI above 70 signals a potential trend change about 75% of the time. So, when RSI crosses this level, it’s a good sign to watch for a price pullback or correction.
RSI Below 30: When RSI is below 30, it means the asset is likely oversold. This suggests that the price has dropped too fast and might soon reverse upward. Around 80% of the time, an RSI below 30 indicates that the price could rise again, signaling a potential buying opportunity.
RSI helps you spot overbought and oversold conditions, which are crucial for deciding when to buy or sell. For example, if the RSI is around 80, the market is likely too bullish, and if it’s around 20, the market may be too bearish.
How RSI Works
The Relative Strength Index (RSI) is a tool used to measure the speed and change of price movements in an asset. It helps determine if an asset is overbought (too expensive) or oversold (too cheap). RSI does this by analyzing recent price changes and comparing average gains to average losses over a set number of periods. The result is a number between 0 and 100, and this number tells you about the momentum of the asset's price.
RSI and Overbought/Oversold Conditions
RSI works with specific levels that help identify when an asset might be overbought or oversold:
RSI above 70: When the RSI is above 70, it means the asset could be overbought. This suggests that the price may have increased too quickly, and a correction or price drop could be near. It indicates that there may be too much buying pressure. In fact, assets with RSI above 70 are often overbought 70% of the time.
RSI below 30: When the RSI is below 30, it indicates the asset could be oversold. This means the price has likely dropped too much, and a reversal or price increase could be expected soon. RSI values under 30 typically show oversold conditions 65-75% of the time. These readings suggest too much selling pressure.
These levels are not always exact but act as important guidelines to help you spot areas where trends may change.
RSI in Momentum Trading
RSI is a momentum indicator, which means it helps you understand how strong the current trend is:
Higher RSI values (above 50) indicate strong bullish momentum. In these cases, buying pressure is dominating the market. If RSI continues to rise, the asset may keep going higher.
Lower RSI values (below 50) show bearish momentum, meaning selling pressure is stronger. When RSI moves below 50, it often signals that the price could continue to fall.
RSI readings in the range of 40-60 typically suggest neutral momentum, meaning the market is in a sideways trend or there’s no clear direction.
Predicting Trend Reversals with RSI
Traders use RSI to spot potential trend reversals by looking at certain patterns. Here are a few important ones:
Divergence: This happens when the price makes new highs, but the RSI does not. For example, if the price continues to rise, but the RSI fails to reach new highs, this suggests that momentum is weakening. In fact, divergence is a powerful signal that often predicts a trend reversal around 70-80% of the time.
Overbought/Oversold Levels: As mentioned earlier, when RSI is above 70, the asset could reverse down (overbought), and when it is below 30, the price might reverse up (oversold). Watching these levels helps confirm when it’s time to enter or exit a trade.
RSI Crossovers: Traders also look at RSI crossovers to predict potential trend changes. For example, when RSI crosses above 50, it usually means bullish momentum is building. Conversely, if RSI drops below 50, it signals that bearish momentum is increasing.
RSI Formula & Calculation

The Relative Strength Index (RSI) is a technical indicator used in financial markets to measure the strength of price movements. It helps traders identify overbought or oversold conditions in an asset.
RSI Formula
The RSI is calculated using the following formula:
RSI = 100 - (100 / (1 + RS))
Where:
RS (Relative Strength) = Average Gain / Average Loss over a set period (typically 14 days).
RSI is measured on a scale of 0 to 100. A higher RSI means stronger buying pressure, while a lower RSI indicates stronger selling pressure.
Step-by-Step RSI Calculation
Step 1: Choose the Time Period
The default setting for RSI is 14 periods (14 days for daily charts, 14 hours for hourly charts, etc.).
Step 2: Calculate Average Gain and Average Loss
For each day in the period, calculate the daily gain (if the price went up) or daily loss (if the price went down).
Ignore losses when calculating average gain and ignore gains when calculating average loss.
Then, find the average gain and average loss over the last 14 periods:
Average Gain = (Total Gains over 14 periods) / 14
Average Loss = (Total Losses over 14 periods) / 14
Step 3: Compute the Relative Strength (RS)
RS = Average Gain / Average Loss
Step 4: Apply the RSI Formula
RSI = 100 - (100 / (1 + RS))
Practical Example
Let’s assume we are calculating RSI for Bitcoin (BTC) over a 14-day period.
Step 1: Calculate Average Gain and Loss
Total Gains over 14 days = (200+300+400+200+300+300+300+200+200) = 2400
Total Losses over 14 days = (200+100+200+100) = 600
Average Gain = 2400 / 14 = 171.4
Average Loss = 600 / 14 = 42.9
Step 2: Compute RS
RS = 171.4 / 42.9 = 4.0
Step 3: Calculate RSI
RSI = 100 - (100 / (1 + 4.0))
RSI = 100 - (100 / 5)
RSI = 80
Interpretation
A RSI of 80 suggests that Bitcoin is in the overbought zone, meaning it might be due for a price correction.
Types of RSI
When it comes to using the Relative Strength Index (RSI), understanding the different types can significantly enhance your trading strategy. Each type of RSI-whether it’s the Standard RSI, Short-term RSI, or Long-term RSI-offers unique benefits depending on your trading style and time horizon. Let’s explore each of these RSI variations to understand how they can support your trading decisions.
Standard RSI (14-period)
The Standard RSI, typically set to 14 periods, is the most commonly used setting in technical analysis. It strikes a balance between providing a responsive measure of price momentum while smoothing out short-term fluctuations. This makes it ideal for most traders who are looking for reliable signals over a moderate time frame.
In this configuration, the RSI measures the average gains and losses over 14 periods to generate a number on a scale of 0 to 100. Key levels, such as 70 (overbought) and 30 (oversold), are crucial for interpreting the market’s strength and identifying potential trend reversals. Traders often use the 14-period RSI to gauge overall momentum and avoid being misled by short-term market noise.
Short-term RSI (7-period or lower)
For traders who need faster signals, the Short-term RSI is a popular choice. By using fewer periods (usually 7 or even lower), this version of RSI reacts more quickly to price movements, providing a higher level of sensitivity. This can be highly beneficial for day traders and scalpers who capitalize on short-term price changes.
The downside is that the Short-term RSI can generate more false signals, especially in volatile markets. However, when combined with other trend-following indicators or price action analysis, short-term RSI can be a powerful tool for spotting entry and exit points faster than the standard RSI.
Long-term RSI (21-period or higher)
If you’re a trader focused on capturing larger market trends, the Long-term RSI is your go-to tool. This version uses a longer period, typically 21 periods or more, smoothing out short-term fluctuations and providing a clearer view of the broader market direction. It’s especially useful for position traders and those aiming to hold trades for longer periods.
The Long-term RSI reduces the risk of false signals that come with shorter time frames, making it a solid choice for traders who prefer fewer but more reliable trade signals. However, because it’s less sensitive, it may not react as quickly to sudden market shifts, making it more suitable for stable or trending markets.
RSI Divergence
An essential concept for traders is RSI Divergence, which occurs when the RSI and price action move in opposite directions. Divergence can signal a trend reversal or a weakening trend, giving traders the opportunity to adjust their positions ahead of significant market changes.
There are two main types of divergence: bullish divergence and bearish divergence. Bullish divergence happens when the price forms lower lows, but the RSI forms higher lows, indicating a potential shift to the upside. Conversely, bearish divergence occurs when the price forms higher highs, but the RSI forms lower highs, signaling a possible reversal to the downside.
Traders often use RSI divergence in conjunction with other indicators, such as trendlines or price action, to confirm potential market turns. Recognizing divergence early can give traders an edge by allowing them to make more informed buy or sell decisions.
How to Use RSI in Crypto Trading?

Understanding how to use the Relative Strength Index (RSI) in crypto trading can give you a powerful tool for making informed decisions. Here’s how you can apply RSI effectively:
1. Identifying Overbought & Oversold Levels
Buy when RSI is below 30: An RSI below 30 indicates that the asset is oversold, meaning it might be a good time to buy as the price could rebound soon. This is typically seen when there is strong selling pressure.
Sell when RSI is above 70: An RSI above 70 suggests that the asset is overbought, meaning the price could be due for a correction or downturn. It’s a signal that the buying momentum might be running out of steam, making it a good time to sell or take profits.
2. Divergence Trading
Spotting Divergence: Divergence occurs when price and RSI move in opposite directions, indicating that the current trend might be losing strength.
Bullish Divergence: If the price is making lower lows but RSI is making higher lows, it can signal a potential bullish reversal.
Bearish Divergence: If the price is making higher highs but RSI is making lower highs, it could indicate a bearish reversal is coming.
Divergence is a powerful signal, but it’s always best to combine it with other indicators for confirmation.
3. RSI + Moving Averages
Combining RSI with moving averages can help you confirm entry and exit points more accurately.
For example, you can use RSI to identify when an asset is overbought or oversold, and use moving averages (like the 50-period MA) to confirm the overall trend.
When the RSI indicates oversold conditions and the price is above the moving average, it might signal a buy opportunity.
Conversely, if the RSI shows overbought conditions and the price is below the moving average, it may indicate a sell signal or trend reversal.
4. Breakout Confirmation
Breakout Confirmation: When the price breaks out of a key resistance level or falls below support, RSI can be used to confirm the strength of that breakout.
If the price breaks out upward and the RSI is also moving up, it confirms the momentum behind the breakout.
If the price breaks downward and the RSI is also falling, it adds credibility to the breakout's strength.
RSI helps confirm that the price move is not just a false breakout but a real shift in trend momentum.
Advantages & Risks of RSI
Advantages
Easy to Use – RSI is simple to understand, making it a great tool for traders of all experience levels. You can easily integrate it into your trading strategy without complicated setups.
Identifies Trend Reversals – RSI helps you spot potential market turnarounds by indicating when an asset is overbought or oversold. This makes it an effective tool for identifying trend reversals early.
Works with Other Indicators – You can combine RSI with other technical indicators like moving averages, MACD, and Bollinger Bands to enhance the accuracy of your trading signals. This provides a well-rounded analysis for better decision-making.
Risks
False Signals – While RSI is powerful, it can sometimes give false signals, especially in strong trending markets. Overbought and oversold conditions may persist for long periods in these trends, leading to potential misinterpretations.
Not Always Accurate – RSI works best when confirmed by other indicators or price action analysis. Relying solely on RSI could lead to missed opportunities or mistakes, so it’s important to use it in conjunction with other tools.
Lagging Indicator – RSI is a lagging indicator, meaning it reacts to past price movements. This can sometimes cause you to miss out on real-time market shifts, especially in fast-moving markets like crypto.
RSI Implementation Formula in Trading
1. How Traders Implement RSI in Trading Strategies
RSI is a versatile tool used by crypto traders to spot potential buy and sell signals. Traders generally use the overbought (above 70) and oversold (below 30) levels to identify entry and exit points. However, RSI divergence (when price moves in the opposite direction to RSI) is also a popular strategy to predict trend reversals. For example:
Bullish Divergence: When price makes a lower low, but RSI forms a higher low, it indicates potential upward movement.
Bearish Divergence: When price forms a higher high, but RSI forms a lower high, it suggests a possible downward trend.
By incorporating RSI with other indicators like moving averages or MACD, traders can enhance the accuracy of their strategies and improve trade timing.
2. Setting Up RSI Indicators on Trading Platforms
Setting up RSI on popular trading platforms is straightforward. Here’s how to do it on TradingView, MetaTrader 4 (MT4), and PriceSync:
TradingView:
Open the chart and click on Indicators at the top.
Search for RSI in the search box and select Relative Strength Index from the list.
The RSI will appear in a new window below the price chart.
To customize the RSI settings, click on the gear icon next to the RSI indicator, where you can adjust the period (default is 14), and modify colors or line styles.
MetaTrader 4 (MT4):
Open your chart and go to Insert > Indicators > Oscillators.
Select Relative Strength Index.
A window will pop up, allowing you to set the period (14 is default) and adjust other settings.
Click OK, and the RSI will appear below your chart.
PriceSync:
PriceSync integrates expert RSI-based setups into its crypto chart analysis.
Simply follow the daily chart setups for fresh insights on RSI levels and price action.
Customize RSI for different timeframes using built-in tools on the platform to match your trading style.
3. Adjusting RSI Periods for Different Trading Styles
The default setting for RSI is 14 periods, but adjusting the RSI period can align the indicator with your specific trading style, whether short-term or long-term.
Short-Term Trading (Day Trading, Swing Trading):
Traders focused on short-term movements often adjust the RSI period to 7-10. This makes the RSI more sensitive, reacting faster to price changes. Short-term traders use this to catch rapid price fluctuations and trend reversals. However, short-term RSI can also generate more false signals, so combining it with other indicators can help avoid confusion.Long-Term Trading (Position Trading, Trend Following):
Long-term traders may use an RSI period of 21 or more to smooth out the noise and focus on major trends. This provides fewer signals, but they tend to be stronger and more reliable. Longer RSI periods are especially useful when trading in strong trends, where the price can stay overbought or oversold for extended periods.
Final thoughts
In summary, RSI (Relative Strength Index) is an invaluable tool for crypto traders, helping to identify whether an asset is overbought or oversold and providing insight into potential trend reversals. Understanding RSI and how to implement it effectively can significantly improve your trade decisions and help you stay ahead in the market. Whether you are a short-term or long-term trader, adjusting the RSI period to fit your style allows you to fine-tune your strategies and boost your success.
If you're ready to master RSI and refine your trading skills, PriceSync offers expert-crafted RSI-based trade setups to guide you through the complex world of crypto. Stay in sync with current market conditions, explore new setups, and apply insights that can elevate your trading game.
Are you ready to take your crypto trading to the next level with RSI and PriceSync? Dive into the platform today and make smarter, more confident trade decisions.


Leave a Comment: